
")


Self-guidance of a blind user in the Tactual Museum. The rightmost picture illustrates several ancient era exhibits which are included in a thematic tour in the ground floor, as they are depicted in scale on the application screen, as well as, in real-time, the current position of the blind user (the one illustrated on the leftmost picture).

Autonomous indoor blind navigation and guidance system preliminary trial in the University of Piraeus.

Autonomous indoor blind navigation and guidance system oral instructions example.

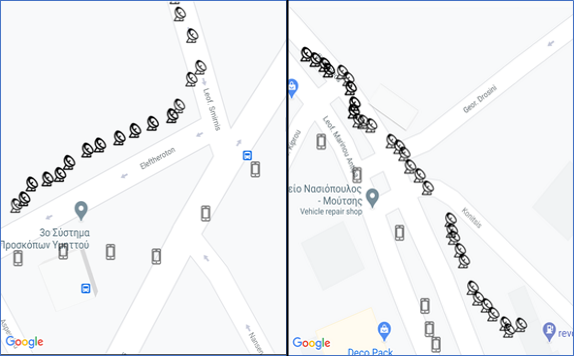
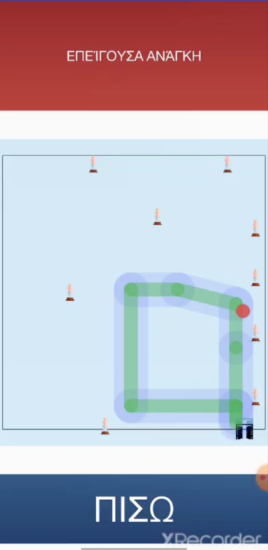
Schematic depiction of the tracking capability of the proposed inertial dead reckoning indoor positioning mechanism which relies on the smartphone accelerometer and gyroscope to effectively calculate walking distance and orientation changes. The figure illustrates the independent travel of a blind user inside an indoor space, from entrance to exit, and the real-time tracking of the motion trajectory, modeled using rectilinear signals and orientations, implemented by the proposed indoor positioning mechanism. The proposed mechanism can also exploit proximity sensors, such as BLE beacons, deployed in the indoor environment. When the blind user goes near to a beacon, the distance of the blind person to the beacon is very accurately determined and therefore the system can correct the potential error of the estimated motion trajectory, as well as re-valuate the inertial dead reckoning parameters towards the ensuing tracking.

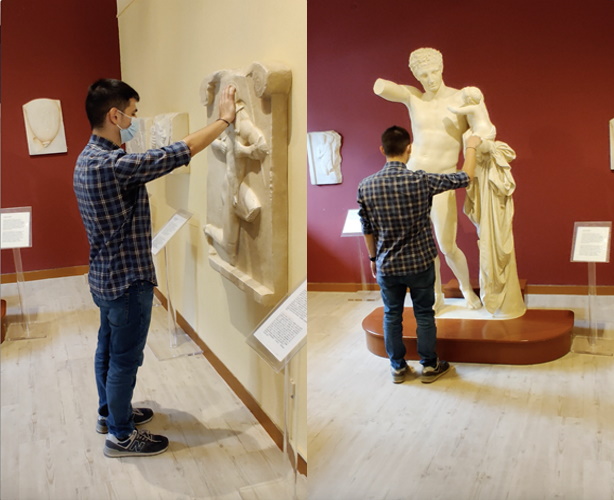
Pilot trials with blind visitors at the Tactual Museum. The blind person wears the smartphone running the autonomous navigation and guidance application in the pocket of his shirt (see top right image). The application guides effectively the blind user towards and inside the Museum rooms across two floors offering an immersive audio and tactual experience of the exhibits.
In the last image, as the application was announcing the wayfinding instructions towards the statue of God Poseidon, which can be slightly seen at the left border of the image, the blind user failed to follow successfully the required body rotation. The application recognized the error in the orientation of the blind user and instructed the user to correct his orientation, as described below:
-
-
- “YOU TURNED MORE THAN REQUIRED”
- "PLEASE TURN RIGHT UNTIL YOU HEAR THE BEEP SOUND”
-
Accordingly, the user is turning right on his axis, but he is turning more than required. The application instructs him again to correct his orientation:
-
-
- “YOU TURNED MORE THAN REQUIRED”
- “PLEASE TURN LEFT UNTIL YOU HEAR THE BEEP SOUND”
-
These corrections are repeated three times until the blind user is oriented correctly.
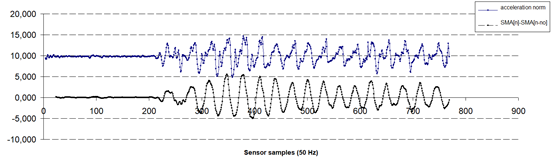
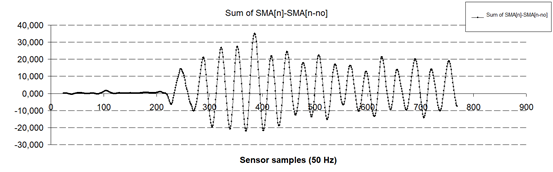
Step detection algorithm: A) Non processed acceleration signal and filtered signal of SMA subtracted by a delayed copy. B) Output of the last step of the algorithm. It refers to a 160cm height female test user that walked along a 10m distance at her typical gait pattern/pace, completing 17 steps with mean step length and period of 0.59m and 570ms, respectively.
Step length calculation through detection of local maxima-minima as they interchange:
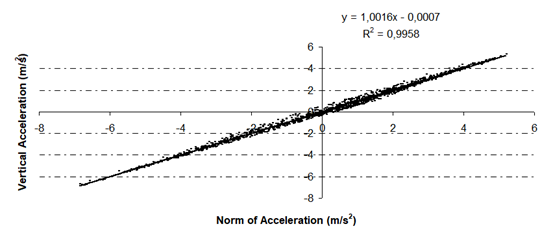
Linear regression between the filtered absolute value of acceleration and the filtered, under the same process, vertical component of it. Out of the processing of trial data involving several users who used the application, the output of the signal derived through the aforementioned process is equal to the output of the vertical component following the same process.
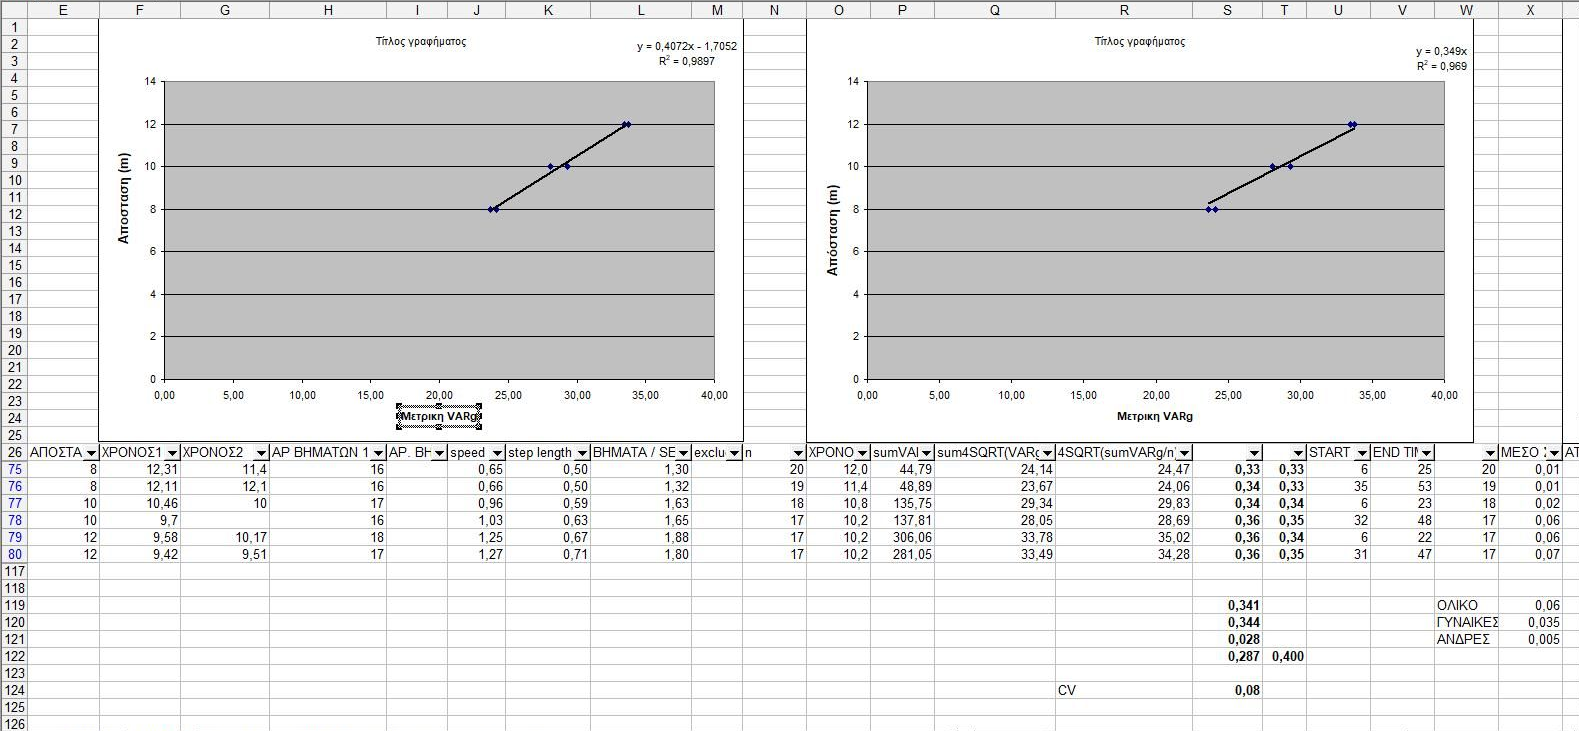
Walking distance calculation trials depicting the walking of 3 pairs of straight route segments of different distance using the own indoor positioning algorithm exploiting the smartphone accelerometer. 21 test male and female users participated in the trials demonstrating similar figures. The calculated value is proportional to the distance, according to the formula (Distance = α * Metric). Walking distance is determined in real time through coefficient α with an average error of 3%. Coefficient α involving the trial users follows a normal distribution which has a mean of 0.345 and minimum standard deviation of 0.0008 and is independent of user height and weight. The average error rises to 6% when the mean value of the coefficient is used without a short route calibration test.
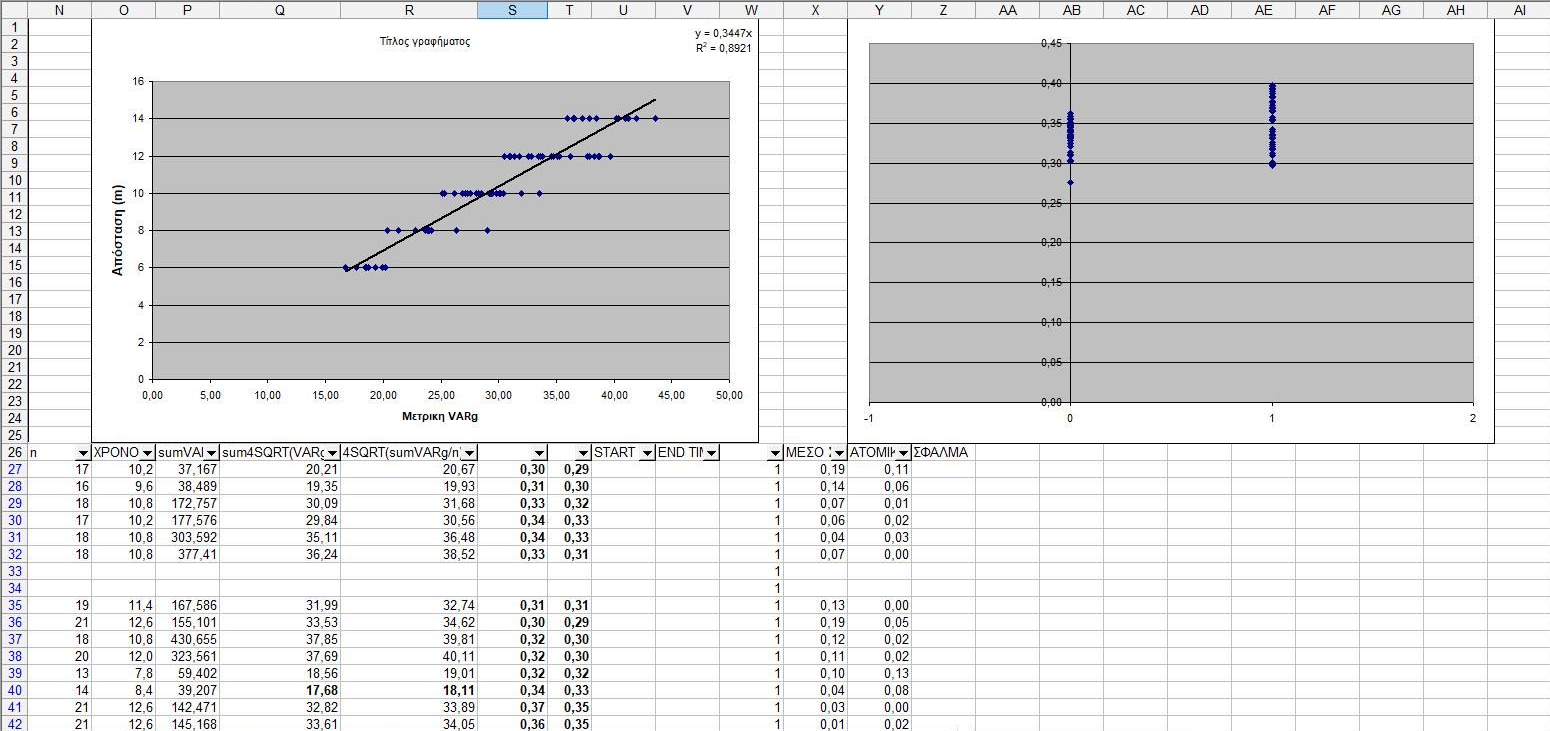
Overall trial data and values of coefficient α per participant sex.
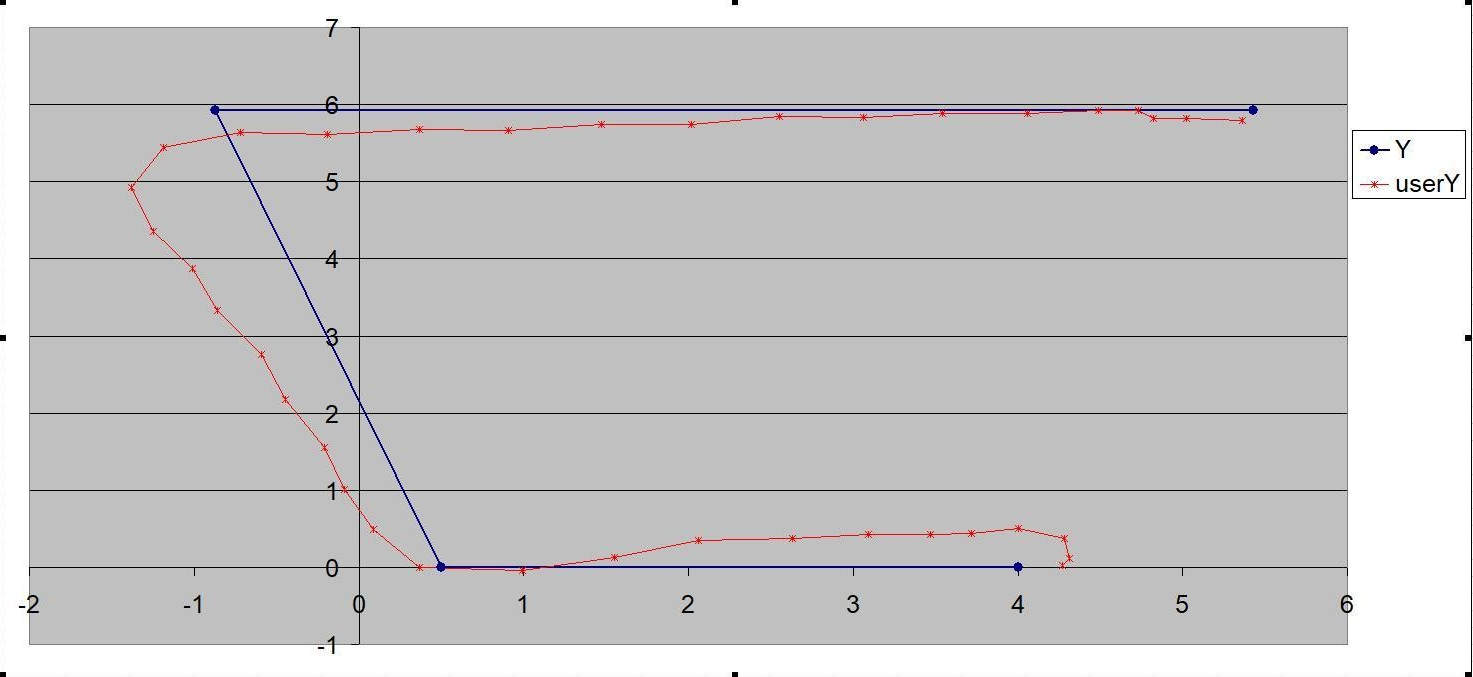
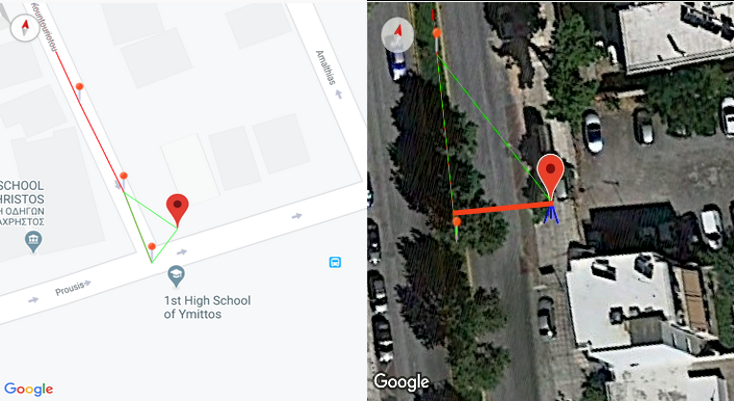
Indoor free travel trial. The blue polygonal line is the path followed by the user. While the user walks on the blue line, the positioning system determines his/her position in real time along the red polygonal line. Axes scales depict area distances in meters.